How a Nuclear Reactor Starts Up
The first time you watch a reactor start up, what surprises you is how boring it looks.
No lever, no dramatic hum, no banks of flashing lights. Just an engineer at a panel pulling a group of control rods out by a few steps, and then waiting, listening to a speaker that clicks once for every neutron the detector catches. Click… click-click… click-click-click. The crew lets the clicking settle, writes down a number, scratches out a quick plot, and only then moves the rods a little further.
So if you want the honest answer to how a nuclear reactor starts up, here it is: very slowly, one small reactivity step at a time, while the people at the controls keep proving the core is doing exactly what the morning’s calculation said it would. I’m a reactor engineer, so this is the sequence I know best, and the rhythm never changes. The reactor is never “switched on.” It is walked up to the edge of a self-sustaining chain reaction. And the part almost nobody outside the control room ever hears about is that most of this work happens while the reactor is still subcritical, making essentially no power at all.
I’ll keep to textbook and public-domain values throughout. Plant setpoints and procedures are design-specific, and none of the numbers below should be read as any particular plant’s limits.
The quietest big moment you’ll ever see
The first time I took part in a criticality, I’ll be honest: I was nervous. A little scared, even. Think about what you’re actually doing. You’re bringing an entire nuclear power plant back to life from a dead shutdown. That does not sound like a small thing.
Then the reactor went critical, and I almost missed it.
No bang, no jolt, no fire on a screen. Everything was so smooth, so procedural, so documented, that every bit of the nervousness just dissolved. Every step was calculated ahead of time. Every move was written down. I have not seen that level of professional efficiency anywhere else. And I think that’s the real surprise: the picture most people carry of a “reactor startup” (explosions, red alarms, a lever thrown) is the exact opposite of the truth. A real startup is proof of how quietly human beings can keep the most powerful reaction we know under control.
How a nuclear reactor starts up, in short
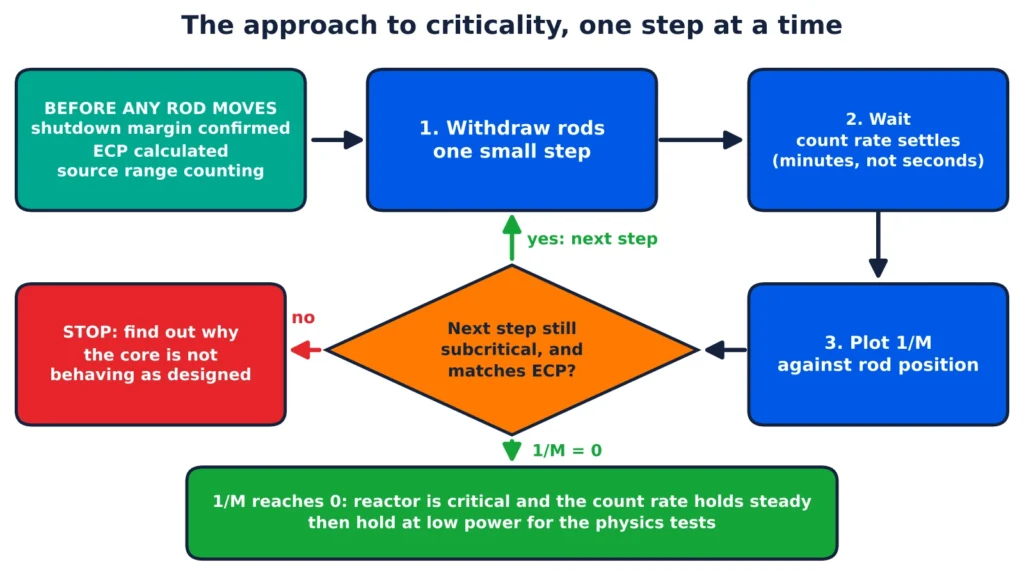
Reactor Engineer first confirm there is enough shutdown margin and compute an estimated critical position for the control rods. They then withdraw rods in small steps while a neutron source keeps the count rate measurable. After each step they wait for the count rate to settle and plot 1/M (inverse multiplication). When 1/M extrapolates to zero, the core is critical. Power is then raised using the delayed neutrons, never the prompt ones, at a controlled startup rate.
What “critical” actually means
Here is the word that trips everyone up. In the control room, “critical” is the goal, not the emergency.
A reactor is critical when each fission leads, on average, to exactly one more fission. That ratio is k, the effective multiplication factor. At k = 1 the neutron population holds steady (critical). Below 1 it dies away (sub-critical). Above 1 it grows (super-critical). That’s the whole idea.
Critical does not mean dangerous, and it does not mean high power. A reactor can be critical at a few watts, which is exactly where every startup aims first. How much power you make is a separate question, set by how many neutrons are present, not by whether k equals 1. The word you actually want to be nervous about is prompt critical, and I’ll get to that near the end.
One habit you pick up fast: we rarely say k out loud. We talk in reactivity, ρ = (k − 1)/k, usually in pcm (percent mille, 10⁻⁵) or in dollars, where one dollar is the delayed neutron fraction. That distinction matters in the last third of this article, so park it for now.
What is Reactivity: In case you wonder what reactivity is? It is the fractional change in neutron population form one generation to the next. Basically it is the tendency of the reactor to increase or decrease the power. You can also interpret reactivity as departure from criticality. Add some positive reactivity (by boron dilution or control rod withdrawal), and power increases. Add some negative reactivity (by borating the primary coolant or control rod insetion), power will decrease.
Before the first rod moves
The approach to criticality begins with a calculation, not a rod. On my side of the job, this is where most of the real thinking happens. Two questions have to be answered before anybody touches anything.
Is there enough shutdown margin?
Shutdown margin is how far below critical the core would sit with all control rods inserted, except the single highest-worth rod assumed stuck out. It’s a worst-case bet: what if the strongest rod fails to go in? If that number isn’t met, nobody moves anything. Full stop.
Where should criticality happen?
After a refueling, the design documents predict a boron concentration against a given rod position, with an error band around it. That margin is the window within which the reactor is expected to go critical. Land inside it and the core is as designed; land outside, and you stop to investigate.
And if you are going to make a reactor critical after a SCRAM, the estimated critical position (ECP) is worked out ahead of time from the basic core reactivity, the direct xenon effect, the indirect xenon effect from iodine still decaying, power defect, rod worth and the coolant temperature.
The DOE Fundamentals Handbook is blunt about what a bad match means: a large gap between the actual and estimated critical position says the core isn’t performing as designed, and it’s a reason to stop and investigate. In practice this prediction is one of the most useful things we carry into the control room, because it’s the yardstick we check reality against, step by step.
Xenon-135 deserves a special mention, because it’s the villain that can quietly kill a startup. Shortly after a shutdown it builds up and can hold the core sub-critical even with every rod withdrawn (depending on fuel cycle’s stage i.e. either you are at beginning of fuel cycle or in the middle or at end), in which case the handbook is clear that you do not attempt the startup. I’ve written about why in the xenon-135 poisoning article and in why reactors run on poison.
The last piece is the neutron source. A subcritical core with no source is a dark room: there’s almost nothing to measure. Spontaneous fission and installed source assemblies give you the neutrons that make the count rate visible. The handbook spells out why this matters for safety too: without a source, rods could pass right through criticality while the detectors are still below their indicating range, and nobody would see it coming. That is exactly the situation you never want to be in.
Subcritical multiplication: why a few neutrons are enough
The easiest way I know to picture this is the feedback squeal you sometimes get between a microphone and a speaker.
You’ve heard it. Someone carries a mic too close to a speaker, a faint sound gets picked up, amplified, picked up again, amplified again, and if the mic gets close enough the whole hall screams “eeeee.” A reactor approaching criticality runs on the same arithmetic.
The “faint sound” is our neutron source, the handful of neutrons we deliberately keep in the core so there’s always something to measure. Each one kicks off a tiny fission chain. While the reactor is subcritical, every chain fades out, the way the PA stays quiet when the mic is far away. But the closer we creep to a self-sustaining reaction, the longer each chain rings before it dies, and the louder the “room” gets.
The numbers are tidy. The neutron level settles at the source times a factor M, where M = 1/(1 − k). At k = 0.6, deeply shut down, M is only 2.5. The detector sees about two and a half times the source, and no more. Now watch as the rods come out and k creeps toward 1: at k = 0.986, M is about 71. Same handful of source neutrons, seventy-one times the signal. That blow-up near k = 1 is the entire reason a detector can tell us how close we are to critical without the reactor ever being critical.
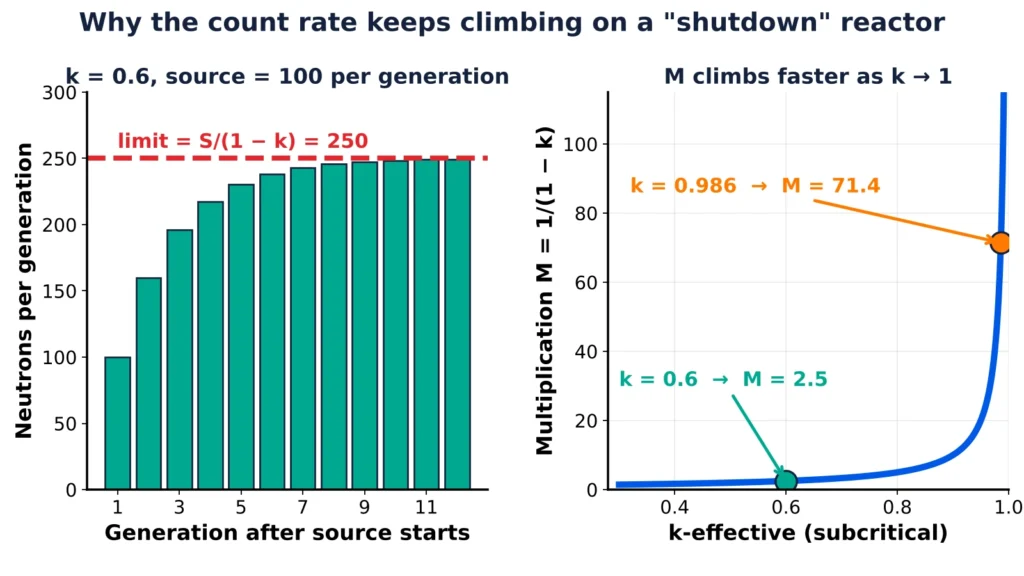
Notice how non-linear that right-hand curve is. Almost all of the multiplication happens in the last few percent of k. That has a very practical consequence at the panel: a detector reading that has merely doubled can still be a long way from critical, but a reading that doubles again after a tiny rod move is a warning you act on immediately.
The 1/M plot: the method that keeps startups honest
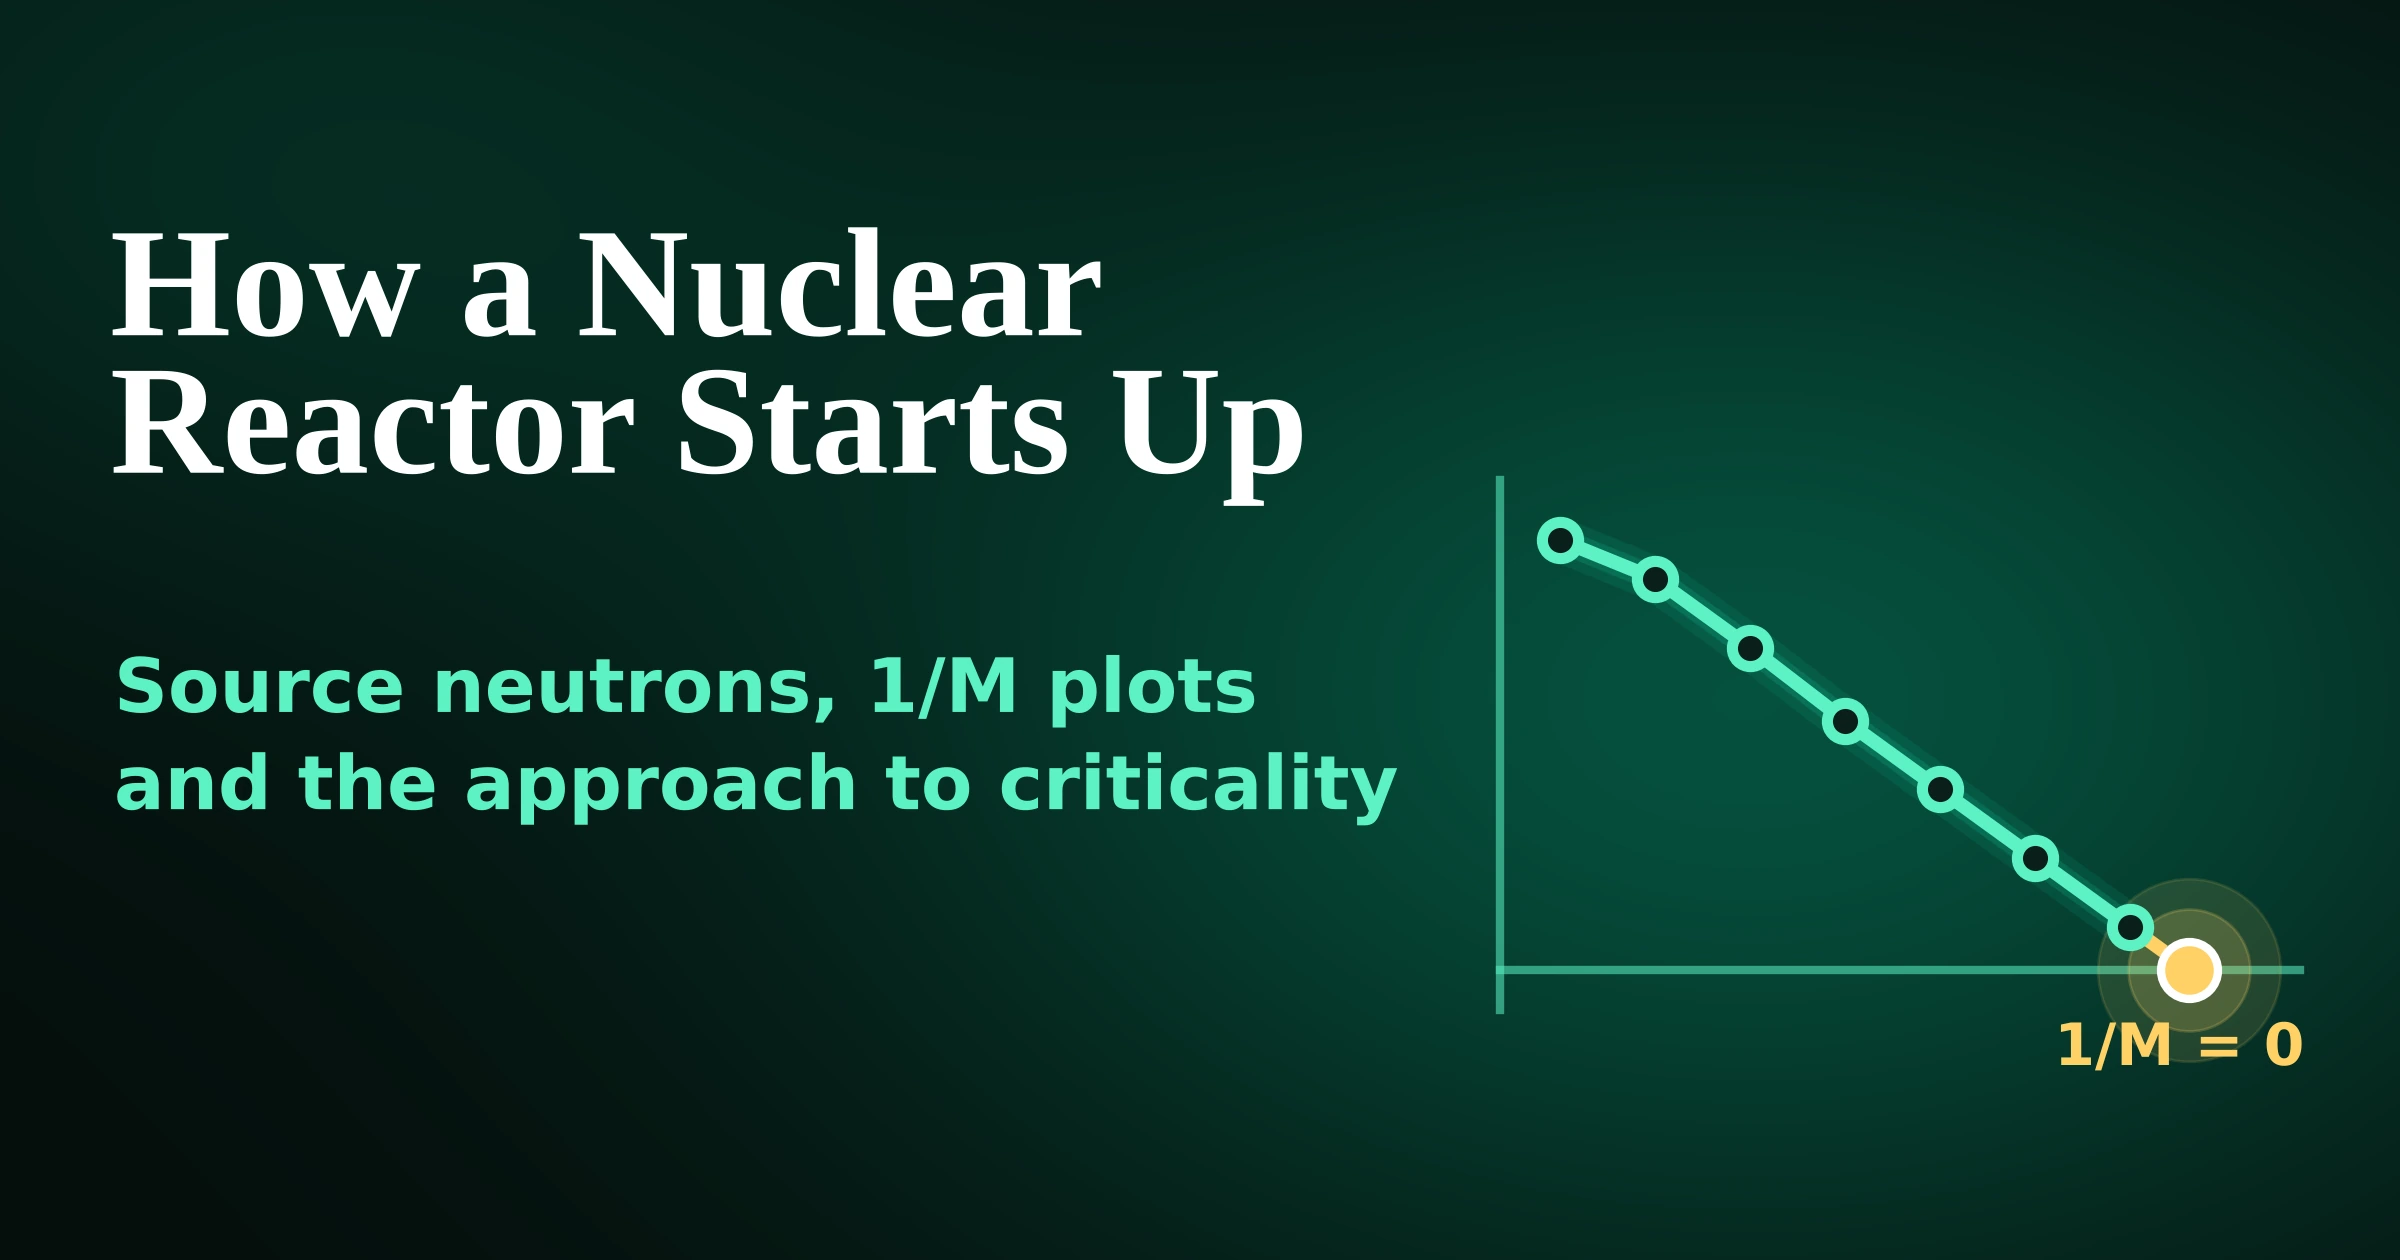
If M is the ratio of the current count rate to the one you started with, then 1/M is just that flipped over. At the start 1/M = 1. As the core approaches critical, M climbs toward infinity and 1/M falls toward zero.
Here’s why we plot 1/M and not the raw count rate: a rising curve that bends upward is almost impossible to read ahead of. A falling curve that heads for zero, you can extend with a ruler. That’s the whole trick. We turn a scary exponential into a straight line walking toward the floor, and that line tells us where critical is before we get there.
The DOE Fundamentals Handbook works an example with a rod withdrawn in 2-inch steps. The count rates were 50, 55, 67, 86, 120, 192 and 500 counts per second, giving 1/M values of 1, 0.909, 0.746, 0.581, 0.417, 0.260 and 0.100. Extrapolated, the line hits zero at about 13 inches.
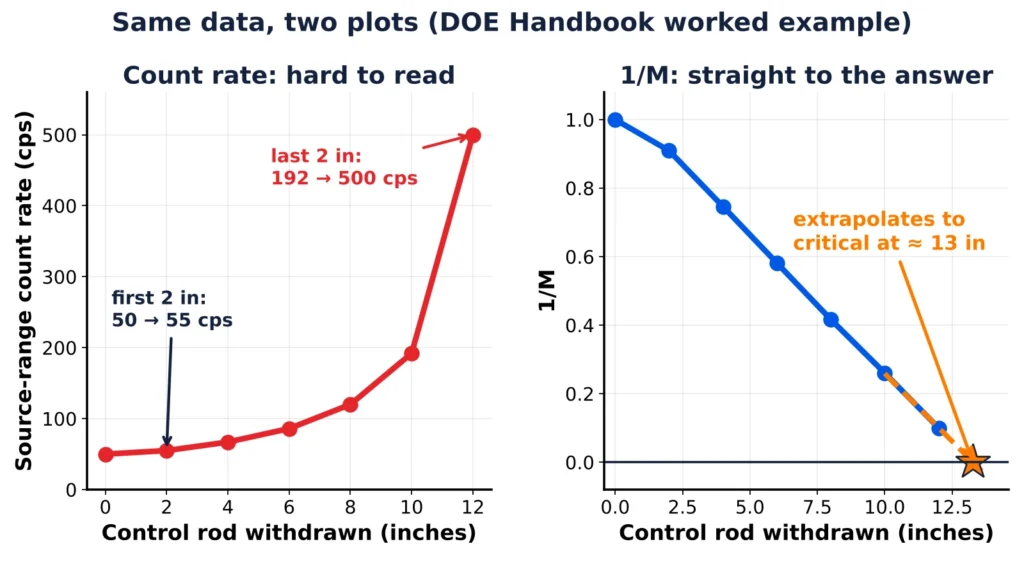
Two rules come with this, and both are drilled into you. First, you wait after each step. A minute or two early on, longer as you get close, because the subcritical chain takes longer to reach equilibrium the nearer k is to 1.
Rush this and your plot lies to you. Second, you check the extrapolation before each withdrawal, so the next step still lands subcritical. The IAEA research reactor exercises (TECDOC-2024) make the same point and add a warning I respect: rod worth is non-linear, so a straight line through early points can flatter you into thinking you’re further away than you are.
The shape of the curve is information too. The Idaho National Laboratory NRIC startup physics assessment notes that a curve bending concave up is the conservative, safe case, while a curve bending concave down can point to too large a fuel addition or a detector that can’t see the core well.
And it’s not only a safety check. In the HTTR, the predicted critical loading was 16 ± 1 fuel columns and the actual was 19, which led to an updated prediction of 18 ± 1. The same document says the 1/M approach confirms the modelling, the fuel and materials manufacturing, the configuration and the instrumentation, all at once. I think of it as a check on the whole chain, not on one number.
The instruments that hand the startup over
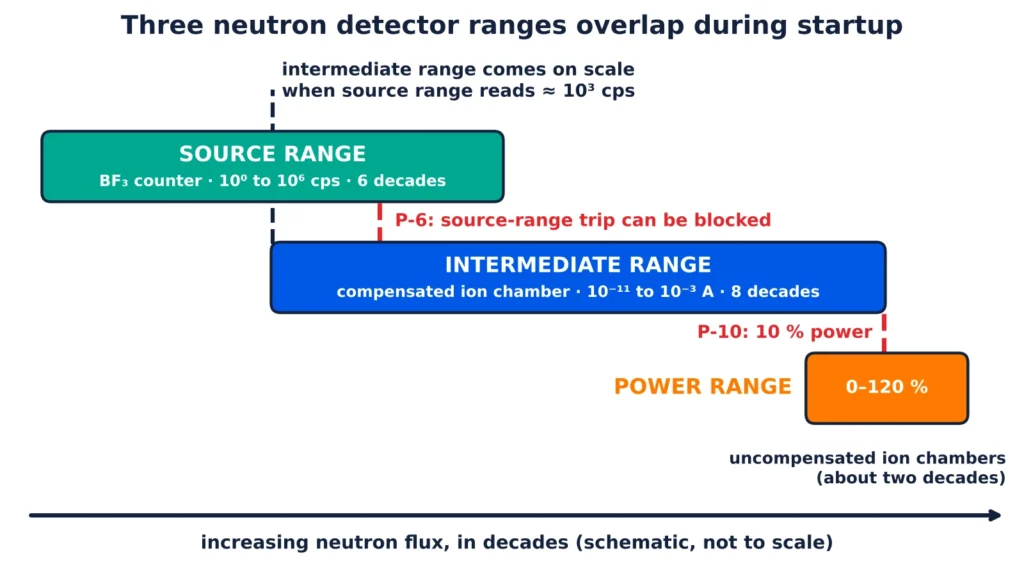
Monitoring a nuclear reactor during startup requires tracking neutron flux across a massive spectrum. Because no single detector covers the whole path from a few counts per second to full power, the instrumentation system relies on three distinct, overlapping neutron flux stages. Each stage uses a different type of detector, handing off monitoring duties to the next like runners in a relay race.
Using the generic Westinghouse PWR (Pressurized Water Reactor) layout as a public reference, here is how these instruments safely manage the approach to criticality and power operation:
- The Source Range (Startup Phase)
* Detector Type: BF3 (Boron Trifluoride) proportional counters.
* Measurement Scale: Roughly 10⁰ to 10⁶ counts per second (CPS) (six decades).
* How it works: This is the ultra-sensitive initial stage. It features the audible “beeper” that alerts the control room crew if the neutron count rate is climbing without them needing to look up.
As the control rods are withdrawn and the neutron flux begins to increase significantly, the source range detectors must be blocked or turned off. This prevents the high flux from saturating or damaging the sensitive proportional counters. - The Intermediate Range (Criticality Phase)
* Detector Type: Compensated ionization chambers.
* Measurement Scale: Covers roughly 10⁻¹¹ to 10⁻³ amperes (eight decades), coming on scale when the source range reads about 10³ cps.
* Why Gamma Compensation Matters: At this stage, the reactor core contains background gamma radiation. Gamma compensation is used to mathematically subtract this gamma noise, ensuring the system reads true, unclouded neutron flux.
* Declaring Criticality: Because it filters out background noise, official nuclear plant protocols (like the Westinghouse PWR Operating Manual) state that criticality is declared via a sustained positive Startup Rate (SUR) without rod motion, immediately followed by stabilizing the reactor core at (10⁻8) Amps in the Intermediate Range for initial physics testing. - The Power Range (Full Operation Phase)
* Detector Type: Uncompensated ionization chambers.
* Measurement Scale: Covers 0% to 120% of full thermal power.
* The Transition: As the reactor transitions into upper power operations, both the Intermediate Range and Power Range overlap to ensure constant surveillance.
Once steady-state power is reached, the signals are finally large enough to matter for core protection and automatic control systems, allowing the uncompensated chambers to take full charge of the reactor’s safety parameters.
We use the generic Westinghouse PWR layout as the example above, because its manual is public.
Going critical: what it’s actually like at the panel
The moment of criticality is an anticlimax by design, and now you know why. 1/M approaches zero, the rate of change of the count rate becomes steady, and the crew holds. Because the neutron level is still very low, the heat produced is far too small to change any temperature.
This is the “point of adding heat,” and below it there’s no temperature feedback to help or hurt you. Your protection comes from automatic shutdown and from the people in the room.
Let me tell you what that room looks like, because I’ve stood in it many times, often on night shift, bringing the reactor critical.
Nothing is improvised. There’s a full pre-job briefing before anyone starts, and a post-job review in the control room afterward. In between, when the reactor is coming to life, every reactivity move happens on the reactor engineer’s command.
I tell the operator when to add reactivity to the system, boration or dilution, and I tell them when to withdraw rods and how many. The operator works the switches; I’m watching the whole time, tracking how fast the reactor is responding (the neutron doubling time) and where it’s heading for critical, through the same 1/M curve we just walked through.
That’s the real reason this job is done so slowly and so step-by-step: the goal is to let the plot confirm that everything is fine before the next rod ever moves.
A small clarification, because it affects how you should read all of this: my scope is reactor engineering, not operations. I’m not the licensed operator at the switches; I’m the engineer who directs and verifies the reactor’s physics as it’s taken critical. Reactivity goes in on my call, and I’m the one checking that the core is behaving the way the nuclear design says it should.
To raise power from critical, the reactor has to briefly become supercritical, because power only rises if k is above 1 for a while. We add a small positive reactivity, watch the startup rate, and take that reactivity back out before power reaches the target. This is where delayed neutrons earn their keep.
Delayed neutrons set the pace
Here’s the fact that makes a reactor controllable at all, and it’s a strange one. About 0.65% of the neutrons from U-235 fission don’t appear at the instant of fission. They come later, from the decay of fission products, with delays from a fraction of a second to nearly a minute. For Pu-239 the fraction is about 0.21%. In an LWR the effective value drifts from roughly 0.0070 early in a cycle to roughly 0.0055 late in life, as plutonium builds up, according to the DOE Fundamentals Handbook.
Why does a fraction of a percent matter so much? A prompt neutron lives about 10⁻4 seconds. If every neutron were prompt, a reactor with k only slightly above 1 would run away faster than anything, human or machine, could respond.
Those few delayed neutrons stretch the effective generation time out to around a tenth of a second. That’s the whole gift: slow enough for rods to move, and slow enough for people to think. Without them, there would be no control room, because there’d be nothing to control.
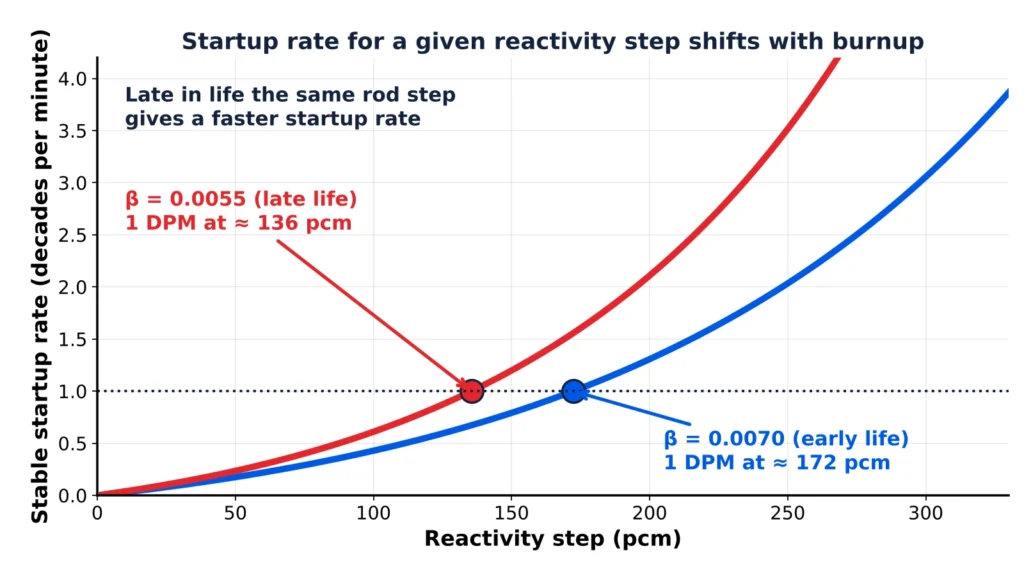
At the panel we express the result as a startup rate (SUR) in decades per minute (DPM). SUR = 26.06/τ, where τ is the stable reactor period in seconds, so a 26-second period is one decade per minute.
Westinghouse puts that at about 175 pcm of reactivity. My own six-group calculation gives about 172 pcm at β_eff = 0.0070 and about 136 pcm at 0.0055. The lesson isn’t the third digit; it’s that an older core gives you a faster startup rate for the same reactivity insertion, so the limits you carried from last cycle shouldn’t be taken for granted.
The signal works in reverse too. After a shutdown, power falls on a period of about −80 seconds, or roughly −1/3 DPM, as the longest-lived delayed groups decay. You can’t drop a reactor to zero instantly, and you wouldn’t want a startup procedure that assumed you could.
If you want to play with these numbers yourself, the point kinetics simulator on this site lets you apply a reactivity step and watch the prompt jump and the delayed rise separately.
Prompt criticality: the line you never cross
Remember the word I told you to be nervous about? This is it.
Prompt critical means ρ equals β_eff, which is one dollar. At that point the reactor is critical on prompt neutrons alone, and the delayed ones no longer set the pace. The tenth-of-a-second breathing room is gone. In Westinghouse terms this is a k of about 1.007.
The DOE Fundamentals Handbook adds an important nuance that I think gets lost in the drama: the reactor period changes smoothly through one dollar. There’s no cliff at exactly $1. What changes is the time scale.
Past it, the handbook describes power increases of several thousand percent in less than a second, which is too fast for any rod or operator. Below it, you can still respond. Figure 6 shows what a step insertion does with no feedback: the prompt jump is bounded below $1, then the delayed neutrons take over.
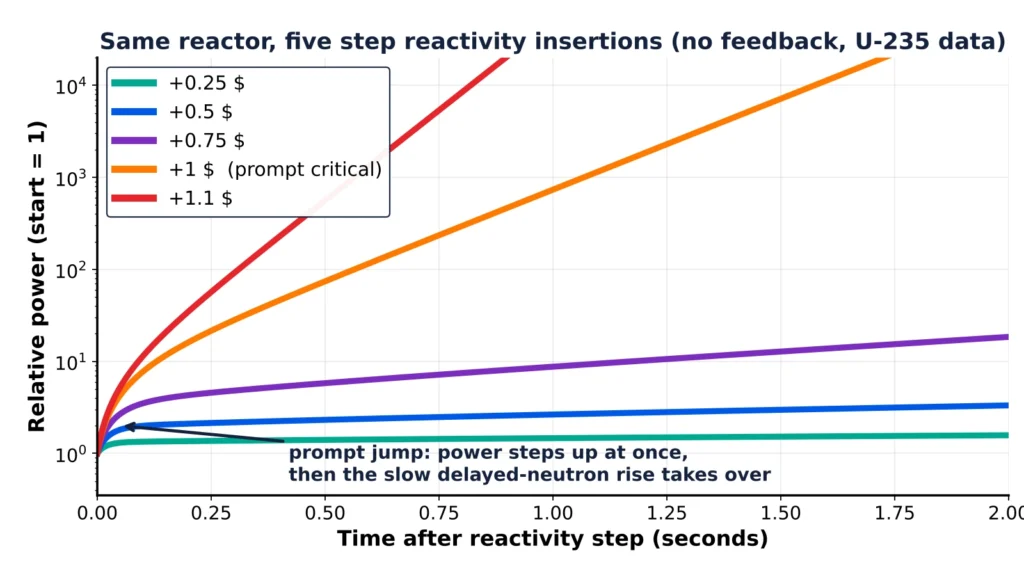
This is exactly why we do startups in small steps and keep the startup rate limited. The whole discipline is built around staying far away from a dollar and never getting close to it by accident.
When it goes wrong
The SL-1 accident in Idaho on January 3, 1961 is the plain example of why control rod withdrawal has to be treated as a reactivity operation, not a maintenance chore.
According to Idaho National Laboratory, a night crew had arrived to finish maintenance and startup work after the Christmas break. Investigators concluded the accident followed one of them manually withdrawing the central control rod, which had a history of sticking, to reconnect it to its drive mechanism. Three men were killed. Every pre-job briefing I’ve ever sat through carries the shadow of that one.
Chernobyl is murkier, and I’d rather say so than repeat a slogan. The NRC’s NUREG-0933 Chernobyl task description describes the accident as “a prompt critical reactivity excursion.”
The IAEA’s own INSAG-7 report describes a reactivity-driven power excursion, with positive void and power coefficients and a positive scram effect, and says it isn’t known for certain what started the excursion. The two documents aren’t contradicting each other so much as using different language. If the exact wording matters to you, read both.
After criticality: what gets measured
Reaching critical isn’t the end of the startup; it’s the start of the real test. At low power, before any heat is added, the crew runs hot zero-power physics tests to check the core against its design: critical boron concentration or rod position, control rod worth, the moderator temperature coefficient (MTC) and core power distribution measurement to ensure core is loaded symmetrically.
The NRIC startup physics assessment lists these as the standard set. This is the part of my job where the morning’s predictions meet reality and either agree or don’t. Only once they agree does power go up in steps through the intermediate and power ranges, with the permissives handing protection from one set of channels to the next.
A related question I get often is what happens when a reactor has to restart after a long outage. The answer depends on xenon, decay heat and how long the core has been shut down; I cover the restart side in can you restart a nuclear reactor, and the role of boron in boron and control rods.
Ultimately, this procedural discipline is why we execute reactor startups with total confidence and professionalism. We do not operate on assumptions; we live by strict procedures and meticulous documentation.
Every single step is calculated, pre-planned, and executed in accordance with proven industry standards. There is no room for confusion because, in the nuclear industry, safety remains the overriding priority above all else.
Frequently Asked Questions
How do you start up a nuclear reactor?
Reactor Engineers confirm shutdown margin and calculate an estimated critical position. They withdraw control rods in small steps, wait for the neutron count rate to settle after each step, and plot inverse multiplication (1/M). When the plot extrapolates to zero the reactor is critical, and power is then raised at a controlled startup rate using delayed neutrons.
How long does it take for a nuclear reactor to start up?
It depends on the reactor and on why it was shut down. The approach to criticality is deliberately slow, with waits after every rod step, and the later power ascent has its own hold points and tests. I haven’t found a verified public figure for a commercial PWR, so I won’t give you a number that sounds authoritative. Ask the plant or read its startup procedure if you need one.
What is criticality in a reactor?
Criticality is the state where the effective multiplication factor k equals 1, so the fission chain reaction sustains itself at a constant neutron level. A reactor can be critical at very low power. Criticality describes the balance of neutron production and loss, not how much power is being produced.
What is the difference between prompt and delayed neutrons?
Prompt neutrons are emitted at the moment of fission and live about 10⁻⁴ seconds. Delayed neutrons, about 0.65% of U-235 fission neutrons, come from the decay of fission products over seconds to about a minute. They stretch the effective generation time to roughly a tenth of a second, which is what makes a reactor controllable.
Did Chernobyl go prompt critical?
The NRC’s NUREG-0933 describes it as a prompt critical reactivity excursion. The IAEA’s INSAG-7 describes a reactivity-driven excursion and says the trigger isn’t known for certain, without using the phrase. The sources differ in wording more than in substance.
Can a nuclear reactor go supercritical?
Yes, and it has to during a startup. To raise power from critical, the reactor is briefly made supercritical (k above 1) in a controlled way, with the startup rate watched closely. The dangerous case is going prompt critical, where reactivity reaches one dollar and the delayed neutrons no longer set the pace.
What slows down neutrons in a nuclear reactor?
The moderator. In a light-water reactor, the hydrogen in water slows fission neutrons down to thermal energies through collisions. This slowing takes microseconds, far shorter than the time neutrons then spend diffusing as thermal neutrons.
Sources and Further Reading
- U.S. Department of Energy, DOE Fundamentals Handbook: Nuclear Physics and Reactor Theory, Volume 2 (DOE-HDBK-1019/2-93)
- IAEA, Research Reactor Exercises for Higher Education Programmes: Compendium (IAEA-TECDOC-2024)
- Idaho National Laboratory, NRIC: Startup Physics Assessment
- Idaho National Laboratory, nuclear history flipbook, SL-1 accident
- U.S. NRC, NUREG-0933, Task CH2: Design Reactivity Accidents / Reactivity Transients
- IAEA, INSAG-7: The Chernobyl Accident: Updating of INSAG-1
- U.S. NRC Technical Training Center, Westinghouse Technology Systems Manual, Section 2.1 (Reactor Physics Review) and Section 9.1 (Excore Nuclear Instrumentation)
About the Author
Elliot Marsh is a working reactor engineer with hands-on experience in reactor physics, core management, reactivity control and fuel-cycle planning at an operating power station. He writes about nuclear energy for readers who want the engineering reality, not the press release.
Need content like this for your company?
I write white papers, technical explainers, and thought-leadership for nuclear vendors, reactor developers, and the agencies that serve them — accurate enough for engineers, clear enough for buyers.